if("you are an absolute beginner in data science")
{
One simple line which summarizes the various works in data industry is "
Data Science, Data Analytics, Machine learning etc are different sides of the same multi-sided polygon".
If you are aiming to step into any of these a strong understanding of statistics will help to pioneer. Statistics expertise is mandatory for data scientist, machine learning experts where as basic is OK for other roles.
Role of
statistics in understanding, analyzing, automated decision taking is inseparable. So, Set your mind to read, learn, understand and apply statistics to see great success in data industry.
}
.....................
To construct a giant, sustainable building, its foundation should be strong. similarly, strong understanding of statistics is necessary for anybody in data industry. so, let strengthen the basics of statistics.
will touch up on:
- Central Tendency
- variance, standard deviation
- Distributions, Normal distribution
- Confidence intervals, degrees of freedom
1. Central Tendency:
A measure of central tendency is
a single value that attempts to describe a set of data by identifying the central position within that set of data.They are also classed as summary statistics. The mean (often called the average) is most likely the measure of central tendency that you are most familiar with, but there are others, such as the median and the mode.
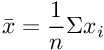
a. Mean(Average)
The mean is equal to the sum of all the values in the data set divided by the number of values in the data set. So, if we have n values in a data set and they have values x1, x2, ..., xn, the sample mean, usually denoted by (pronounced x bar), is:
Ex: Mean for a given set can be computed as follows:
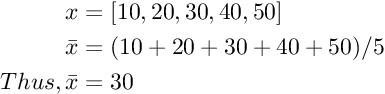
- Mean can be calculated for both continuous and discrete data as well.
- It is the only center tendency measure which considers each data input.
- It suffers with Outliers.
b. Median
Median is the middle value in a sorted data set. For a data set with even number no.of elements, average of both the values will be the median
x = [23, 40, 6, 74, 38, 1, 70]
sorted_x = [1, 6, 23, 38, 40, 70, 74]
Median is 38.
- unlike mean, it doesn't suffer much because of outliers
c. Mode
Most common value in the data set. Mode is most useful when you need to understand clustering or number of ‘hits’. For example, a retailer may want to understand the mode of sizes purchased so that he can set stocking labels optimally. Say, store A has a mode of ‘small’ while store B has a mode of ‘XXL’.
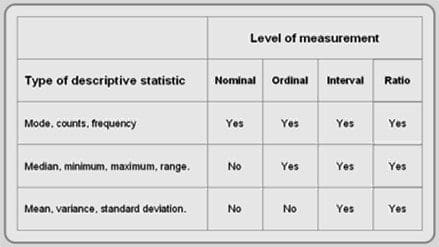
Based on type of variables, we need to choose the right central tendency measure. Cheat sheet for it is,
Read about types of variables
here.
Now, we have read about measures of central tendency. i.e. What is the central value of the data set. It talks about center values, doesn't talk about how data was spread. To understand that, we need to consider,
- Variance(σ^2)
- Standard Deviation (
σ)
Unlike range and quartiles, the variance combines all the values in a data set to produce a measure of spread.
1. Variance
variance is a measure of how spread out a data set is.Variance is the average of the squared differences from the mean.
Variance (S2) = average squared deviation of values from mean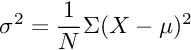
Difference is squared to avoid cancelling of values above mean and below mean.
As the inputs are squared, units are not same for Variance and the data.
Standard Deviation, is the Square root of the variance.
2. Standard Deviation:(σ)
It measures spread around the mean. Because of its close links with the mean, standard deviation can be greatly affected if the mean gives a poor measure of central tendency. Understanding Standard deviation is very important to understand the data spread. its the one referred in six sigma technique.
The data set with the smaller standard deviation has a narrower spread of measurements around the mean and therefore usually has comparatively fewer high or low values. An item selected at random from a data set whose standard deviation is low has a better chance of being close to the mean than an item from a data set whose standard deviation is higher.
Generally, the more widely spread the values are, the larger the standard deviation is.
Although standard deviation is less susceptible to extreme values than the range, standard deviation is still more sensitive than the semi-quartile range. If the possibility of high values (outliers) presents itself, then the standard deviation should be supplemented by the semi-quartile range.
If

= mean,
σ = standard deviation and
x = a value in the data set, then
- about 68% of the data lie in the interval: - σ < x < + σ.
- about 95% of the data lie in the interval: - 2σ < x < + 2σ.
- about 99% of the data lie in the interval: - 3σ < x < + 3σ.
Next Posts:
3. Distributions and Normal distribution:
4. Confidence intervals, degrees of freedom